Wireshark essential tutorial
What we are going to do?
In this post, we will start learning Wireshark from the
scratch. I’ll show the menus, filters and many other options. Most of the
people know about Wirehsark, but they don’t want to try it, because they simply
don’t know how to write filters. My key focus will be on creating filter, not
writing filters. Yes it is true, that you can make filters without learning
those filter parameters. On simple words, you can use Wireshark without
touching the keyboard. Those who have kali linux, they have it in Kalilinux.
I’ll be using wireshark 32 bit version. I’ll concentrate on HTTP traffic
throughout the tutorial. So let’s start with little bit of theory
What is Wireshark?
Wireshark is an open source packet analyzer, and it’s
completely free. It is very popular and
widely used for network troubleshooting, packet analysis and communications
protocol development. Wireshark is cross-platform, available in both 64 bit and
32 bit architecture. It uses the Qt widget toolkit in current releases for its
user interface and uses pcap to capture packets. It runs on all popular flavors of Linux,
macOS, BSD, Solaris, some other Unix-like operating systems, and of course Microsoft
Windows too. There is also a non-GUI, terminal-based version called TShark,
just in case if you need to run it a Linux server or something, which is also free
software.
Why Wireshark?
It doesn’t matter whether you need to perform a packet
analysis or troubleshoot something on your network; Wireshark is the tool for
you. Wireshark can capture packets in real time and display them in
human-readable format. Wireshark is enriched with different types of filters and
individual color-coding for defining individual format, errors or types and
other features that let you to have deep insight into your network traffic and inspect each and
every packet individually. Wireshark has become as standard for many industries
and organization to have a microscopic view of packets in and out of the
network.
Those who don’t have Wireshark can download it from
You can have lots of other information from the following
URL
Wireshark Menus
There are altogether 7 sections in Wireshark. Explaining each
and every option in it, needs more than just a blog post. So I’ll just go through the essentials. If
you want open a capture file, you have that open in main menu under file. Or if
you want to generate a graph of packets received or sent, you can have it under
statistics. You can start live capture by clicking on the shark fin in toolbar.
And to stop, click on the square next to it. Then we have display filter in
which we write or create filters. Those green left and right arrow works just
like the windows explorer, click on left arrow to go back to previous packet
and click on right arrow to next packet. And the very next icon to right arrow
helps you to jump in to a specified packet number.
The packet pane shows packets captured in numerical order.
If you click on a packet, that packets details will be shown on packet details
pane. The packet details pane says FRAME 1, in which 1 is the packet selected
in packet list pane.
The packet list pane is ordered according to tcp/ip suite
(internet protocol suite). It got 5 parts, top in packet details pane is the physical
layer, then link layer, internet layer , transport layer and application layer
respectively.
Just below packet details pane we have packet bytes pane,
which shows the hexadecimal form of the section selected in packet details pane
At the end we have the status bar which shows total number
of packets, 771, then displayed packets, which defines number of packets after
applying filters. Time it took to load Etc.
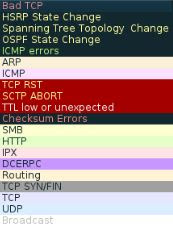
Wireshark color codes.
Your capture in the packet list pane, will be highlighted
with colors, each color has a meaning, well you’ve have the power to change it
or completely disable this feature if necessary.
How to capture?
In Wireshark, either we can do a “Live Capture” or we can
ask for Wireshark to open a capture file for us.
How to analyze?
The traditional way of analysis to type the necessary filter
in to the display filter pane. When I typed DNS is automatically filter out all
my dns packets. Truth is, you don’t need to type in a filter instead you can
just select one from packet detail pane and apply it as filter or choose from a set of presets.
Here I’ve selected a DNS entry in packet detail pane , right
clicked on it, then selected apply filter and choses my condition selected. Or
else simply you can select the expression in display filter pane and select a
preset.
How to follow a TCP Stream.
If you would like to know full story of what machine A
talked to machine B, then Stream is the option will come to use. Right click on
packet and select follow > tcp stream. Then you’ll be welcomed with a new
window in which you can just scroll between each window of packet sent and
received as show below.
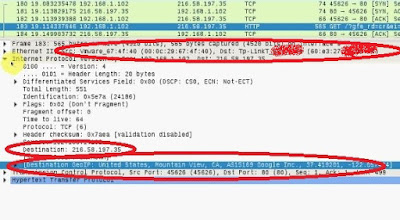
How to perform lookups?
At this version of wireshark (2.0.2), you don’t worry about
manually lookup IP address , MAC address (OUI lookup). Any packet received in wireshark
will be automatically resolved. You can also the the mac address lookup has
resolved the mac address of the source as Vmware and destination as TP Link.
Want to see Wireshark in action?


The Certified Authorization Professional (CAP) certification identifies enterprise system owners and security officers who authorize and maintain information systems, with a focus on balancing risk with security requirements and countermeasures. The CAP credential is aimed at the private and public sectors, including U.S. federal government agencies such as the State Department and the Department of Defense (DoD). Achieving the certification helps DoD personnel comply with the 8570 Mandate.
ReplyDelete